Documentation — version 14
Data » Online Spreadsheet with data for countries, regions and global — v14
Summary Documentation of V14
Sources
Period 1800-1970, main source: v7, by Mattias Lindgren
We use the data from our own version 7 below, which is based on 100 sources compiled by Klara Johansson and Mattias Lindgren. Mattias also assessed the fatal impacts of the biggest disasters in history and made rough guesstimates showing in the charts as sudden dips in life expectancy.
Period 1950-2019, main source: IHME
We used the Global Burden of Disease Study 2019 which has data for 1950-2019, from IHME, the Institute for Health Metrics and Evaluation, University of Washington, Seattle, published on October 15, 2020. Accessed on December 10, 2020.
Back to 1950, we use data from the Global Burden of Disease Study 2019 of the Institute for Health Metrics and Evaluation (IHME) of the University of Washington, Seattle; which has data for 1950-2019 and it was published in October 2020. Annual estimates were downloaded from the GBD Website http://ghdx.healthdata.org/record/ihme-data/gbd-2019-life-tables-1950-2019, zip file downloaded here using a file named IHME_GBD_2019_LIFE_TABLES_1950_2019_ID_28_WSHOCK_Y2020M11D13.CSV
Period 2020-2100, main source: UN
We used UN forecasts from World Population Prospects 2022 published in the file with annually interpolated demographic indicators, called WPP2022_GEN_F01_DEMOGRAPHIC_INDICATORS_COMPACT_REV1.xlsx, accessed on April 13, 2023.
How these three sources were combined
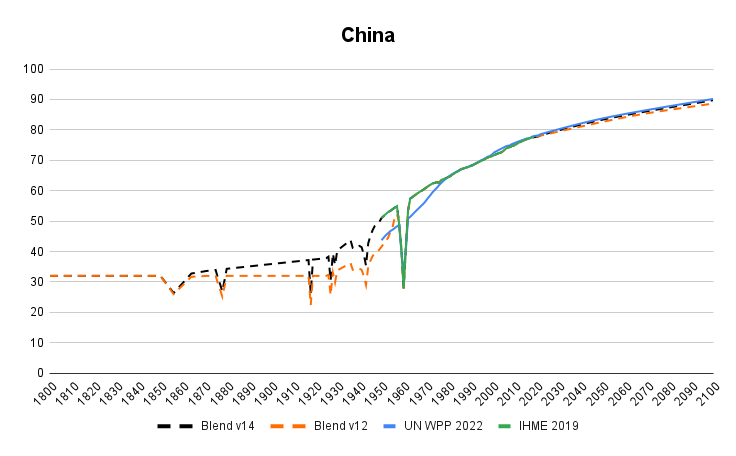
Whenever IHME has data we use it, which is for almost all countries and years between 1950 to 2019. The UN source has data between 1950 to 2100, but before 1950 we use Gapminder’s version 7 instead because the UN data is “smoothed out” and doesn’t show clearly which year a dip in the curve occurred. For years before 1950, we have taken Gapminder v7 and adjusted it during 100 years so that it meets IHME data the first year it exists, as in this example for China:
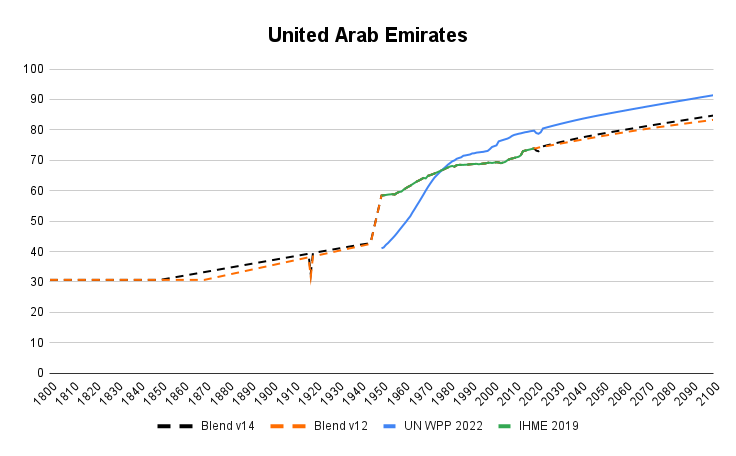
After 2019, we have extended the IHME series with the UN estimates and forecasts, as you can see with the United Arab Emirates graph below. But we haven’t extended it with the UN actual number. We extended it with the UN change rate. In the example of the United Arab Emirates IHME estimates, Life Expectancy in 2019 is to be 73.9 years. That is almost five years lower than the UN estimate: 79.7 years. This means that we use the expected increase from the UN for the year 2019 and beyond, but we apply it to the lower estimate from IHME.
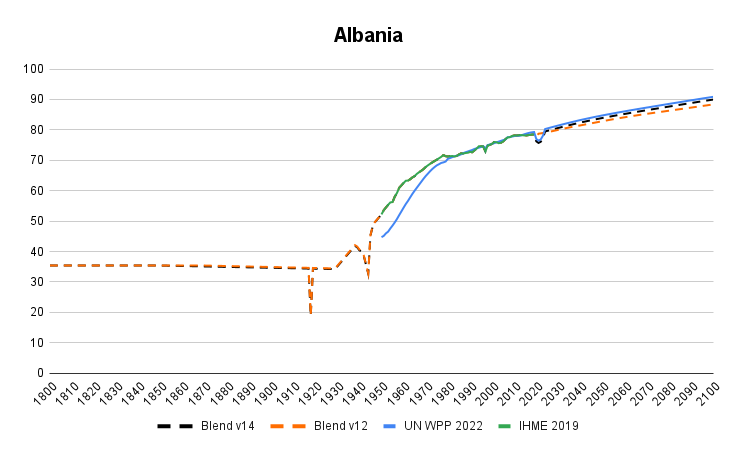
Another example is Albania, where the IHME Life Expectancy in 2019 is 78.5 years. This is almost equal to the UN estimate: 79.3 years. This means that we apply the expected growth from the UN from the year 2019 and beyond to the estimate from IHME.
When we show data for 2020, that number doesn’t come directly from IHME, but it’s the 2019 number from IHME with the percentage change in UN estimate extending it to 2020.
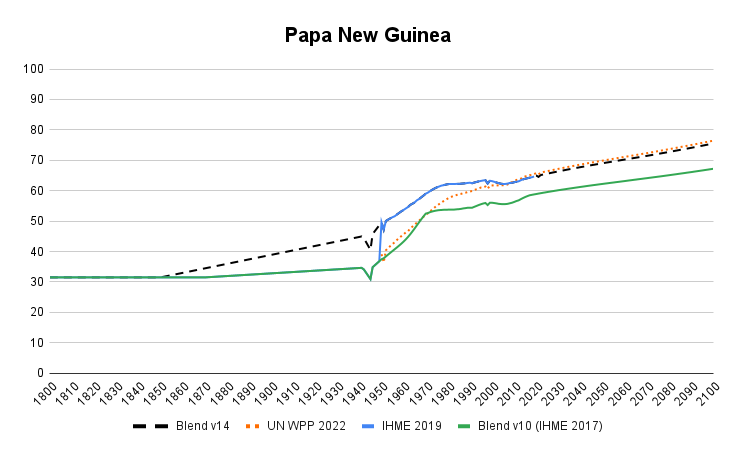
In many cases, the new estimates from IHME improved a lot from the previous releases. This means that many countries moved their position in our chart when we updated the data and changed drastically because they improved their method of modeling HIV and other diseases. In previous Gapminder v10, we used the IHME 2017 data, which had a life expectancy for Papua New Guinea at 58.5 in 2017. The new IHME data puts it on 64.27, which is one of the largest changes. This shows up in this example, where you can see the green line of Gapminder v10, far below the updated lines.
Global and regional averages
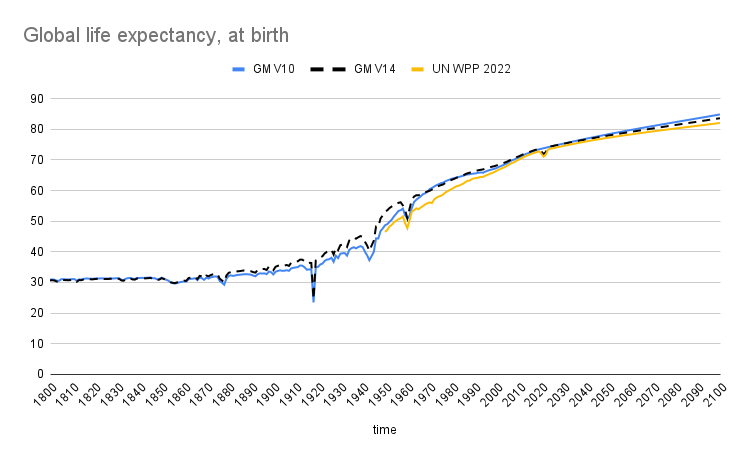
The global total life expectancy is using the IHME numbers from 1950 to 2019. For years before this period, we calculated the average weighted by population for each country. The proper way to calculate it would be to account for the number of people of different ages, but that would require much more work. Our calculated weighted average, 2019: 73.6 years, is close to the properly calculated number from IHME, 2019: 73.5 years. After 2019, we have applied UN expected change to IHME estimates as it is shown in the graph below:
Regional averages were also calculated as weighted by countries’ population size.
Detailed documentation and feedback
For transparency, we provide the files we used to calculate this data here. Any questions about the data and suggestions for how to improve it are always very welcome in our data forum.
Previous versions
Documentation — version 12
Data » Online Spreadsheet with data for countries, regions and global — v12
Summary documentation of v12
Sources
Period 1800-1970, main source: v7, by Mattias Lindgren
We use the data from our own version 7 below, which is based on 100 sources compiled by Klara Johansson and Mattias Lindgren, Mattias also assessed the fatal impacts of the biggest disasters in history and made rough guesstimates showing in the charts as sudden dips in life expectancy.
Period 1970-2016, main source: IHME
We used the Global Burden of Disease Study 2017 which has data for 1990-2017, from IHME, the Institute for Health Metrics and Evaluation, University of Washington, Seattle, published in November 2018. Accessed on October 14, 2019. Back to 1970, we use data from the Global Burden of Disease Study 2016 of the Institute for Health Metrics and Evaluation (IHME) of the University of Washington, Seattle; which has data for 1970-2016 and it was published in September 2017. Annual estimates were downloaded from the GBD results tool http://ghdx.healthdata.org/gbd-results-tool; and data for every five years can be found in Appendix Table 6, published in the Lancet article, zip file downloaded here using a file named IHME_GBD_2017_MORT_1950_2017_SR_TABLE_6_Y2018M11D08.XLSX and Appendix Table 13A published with the Lancet article, zip file downloaded here using a file named IHME_GBD_2016_MORTALITY_1970_2016_APPENDIX_TABLE_13A_Y2017M09D14.XLSX
Period 2017-2099, main source: UN
We used UN forecasts from World Population Prospects 2019 published in the file with annually interpolated demographic indicators, called WPP2019_INT_F01_ANNUAL_DEMOGRAPHIC_INDICATORS.xlsx, accessed on October 14, 2019.
How these three sources were combined
Whenever IHME has data we use it, which is for almost all countries and years between 1970 to 2017. The UN source has data between 1950 to 2099, but before 1970 we use Gapminder’s version 7 instead because the UN data is “smoothed out” and doesn’t show clearly which year a dip in the curve occurred. For years before 1970, we have taken Gapminder v7 and adjusted it during 100 years so that it meets IHME data the first year it exists, as in this example for China:

After 2017, we have extended the IHME series with the UN estimates and forecasts, as you can see with the Nicaragua graph below. But we haven’t extended it with the UN actual number. We extended it with the UN change rate . In the example of Nicaragua IHME estimates, Life Expectancy in 2017 is to be 78.8 years. That is almost five years higher than the UN estimate: 74.07 years. This means that we use the expected increase from the UN for the year 2018 and beyond, but we apply it to the higher estimate from IHME.

Another example of Albania, where the IHME Life Expectancy in 2017 is 72.23 years. This is almost equal to the UN estimate: 72.33 years. This means that we apply the expected growth from the UN from the year 2018 and beyond to the estimate from IHME.

When we show data for 2018, that number doesn’t come directly from IHME, but it’s the 2017 number from IHME with the percentage change in UN estimate extending it to 2018.
In many cases, the new estimates from IHME improved a lot from the previous releases. This means that many countries moved their position in our chart when we updated the data and changed drastically because they improved their method of modeling HIV and other diseases. In previous Gapminder v9, we used the IHME 2016 data, which had a life expectancy for Iraq at 67.68 in 2016. The new IHME data puts it on 76.74, which is one of the largest changes. This shows up in this example, where you can see the light blue line of Gapminder v9, far below the updated lines.

Global and regional averages
The global total life expectancy is using the IHME numbers from 1970 to 2017. For years before this period, we calculated the average weighted by population. The proper way to calculate it would be to account for the number of people of different ages, but that would require much more work. Our calculated weighted average, 2017: 73.13 years, is close to the properly calculated number from IHME, 2017: 72.97 years. After 2017, we have applied UN expected change to IHME estimates as it is shown in the graph below:

Regional averages were also calculated as weighted by countries’ population size.
Detailed documentation and feedback
For transparency, we provide the files we used to calculate this data here. Any questions about the data and suggestions for how to improve it are always very welcome in our data forum.
Version 9
Download » Excel file with data for countries, regions and global total- v9
Version 7
» What is new in version 7 (pdf)
» Excel with data, sources and other metadata
» Download documentation (pdf)
» Guesstimating life Expectancy for disasters (pdf)
» Go to the google-spreadsheet that contains a copy of the data
» Go to the google-spreadsheet that contains a copy of the data, including projections
» Download reference files for each country from Prof. James C Riley’s bibliography for Average life expectancy at birth (zip-archive)
» Visualise indicator (Line qraph with colors illustrating the data quality).
Version 6
» Excel with data, sources and other metadata – version 6
Version 5
» Excel with data, sources and other metadata – version 5