Documentation — version 8
Visit the online spreadsheet with population data for all countries and world regions from 1800 to 2100, or download the Excel file »
Summary documentation of v8
Our population data is divided into two chunks. One long historic trend for the total global population that goes back all the way to 10,000 BC. And the second chunk is country estimates that only reaches back to 1800.
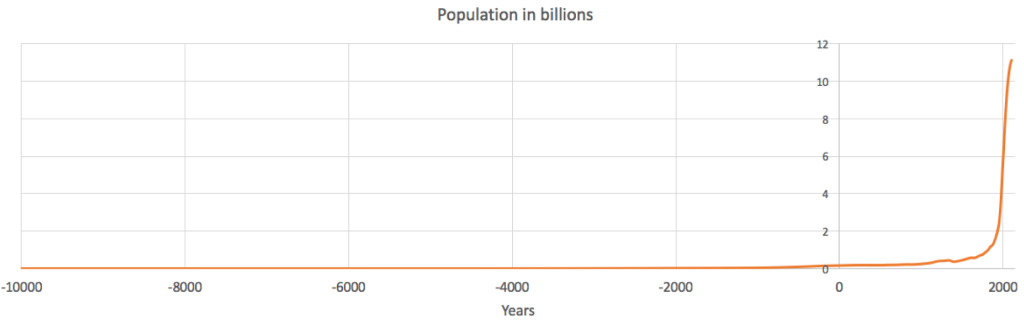
Chunk 1: Global population trend since 10,000 BC
Thousands of years ago, nobody was counting the number of people on the planet. So the all estimates are uncertain, but the numbers from different sources are quite similar. In this excel file you can see the different numbers alternative sources we have used, which resulted in this curve:
Sources by period
— 1650: McEvedy & Jones “McEvedy, Colin and Richard Jones, 1978,”Atlas of World Population History,” Facts on File, New York, pp. 342-351.” As cited by US census bureau
— 10.000 BC to – 1900 (except 1650): Biraben (except 1650 from McEvedy Jones) “Biraben, Jean-Noel, 1980, An Essay Concerning Mankind’s Evolution, Population, Selected Papers, December, table 2. As cited in US census bureau”
— 1800 to 1949: We use Maddison population data improved by CLIO INFRA in April 2015 and Gapminder v3 documented in greater detail by Mattias Lindgren. The main source of v3 was Angus Maddison’s data which is maintained and improved by CLIO Infra Project. The updated Maddison data by CLIO INFRA were based on the following improvements: i. Whenever estimates by Maddison were available, his figures are being followed in favor of estimates by Gapminder; ii. For Africa, estimates by Frankema and Jerven (2014) for the period 1850-1960 have been added to the existing database; – For Latin America, estimates by Abad & Van Zanden (2014) for the period 1500-1940 have been added.
— 1950-2100: We use UN POP from their World Population Prospects 2024 published in the file with annually interpolated demographic indicators, called WPP2024_POP_F01_1_POPULATION_SINGLE_AGE_BOTH_SEXES.xlsx, accessed on July 25, 2024.
Chunk 2: Countries and regions: 1800 to 2100
Between 1800 to 1950, we use Clio infra Population data v2015 whenever available otherwise we use Gapminder population data in version 3.From 1950 up to 2100, we use UN POP data and the forecast to year 2100 is using their medium fertility variant.
When combining the historical data with the new UN data, the trends for a few countries didn’t match up in the overlapping year 1950, and small adjustments were made to the years before to smooth out the discrepancy between the two sources to avoid sudden jumps in our visualisations.
For transparency we provide the files we used to calculate this data here. Any questions about the data and suggestions for how to improve it are always very welcome: to contact us on [email protected]
Previous versions
Version 7
Version 6
Version 5
Version 3
Data from 1700 to 2100 as well as data for several countries before 1700.
The excel-file include all available observations, together with meta-data for each observation. In version1 of this data we also included “data quality” for each observation. The data quality indicator has not been updated, so it refers to the earlier version.
» Download documentation (pdf)
» Download Excel-file with data, including interpolations & detailed meta-data (xlsx)
» Go to the google-spreadsheet that contains a copy of the data
» Visualise indicator (Gapminder World, the size of bubbles)
» Visualise indicator with projections (Gapminder World, the size of bubbles)
Version 1
» Download documentation (version1) (pdf)
» Download Excel-file with data, including interpolations & detailed meta-data for version 1 (xlsx)
» Go to the google-spreadsheet that contains a copy of the “data quality rates” for the indicator (version 1)